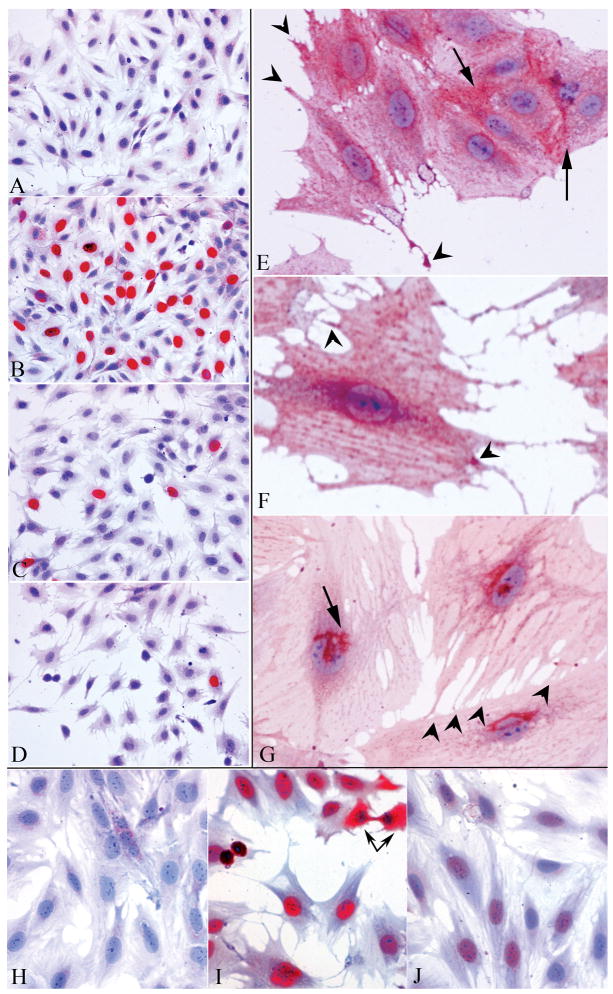
Fig. 3.
In situ antibody studies of proliferating and stationary cells at 2 days. Fig. 3A-D shows cells exposed to BrdU for 2 hr. No BrdU is detected in controls exposed only to the 2nd antibody (A) whereas many BrdU positive (red) nuclei are observed in proliferating SEP cells at 33°C (B). There is a marked reduction in BrdU positive cells fed with 2% serum (C) or 1% serum (D) at 37.5°C. Fewer cells are also apparent, and arrested cells show more extensive thin processes but no change in overall cell size. Fig. 3E-G show cells labeled with the NH2-PrP antibody arrested in 2% serum. Fig. 3E shows a growth cone and other extending process tips with intense PrP staining (arrowheads). Note intense staining between several closely adjacent cells at membrane contact regions (arrows). In F, red dots of PrP are aligned on the plasma membrane, horizontally orientated to cytoplasmic stress fibers. The lower arrowhead points to an intense positive signal where the process from another cell contacts the large cell body. The other arrowhead shows increased PrP in varicosities of an extending nanotube. The cell in G was extracted with 0.2% saponin prior to NH2-PrP detection. The plasma membrane signal is abolished and the characteristic Golgi region is prominently stained (arrow). Many tiny processes connect to the bottom cell (arrowheads). Figs. 3H-J show T antigen staining at 2 days. The control (H, 2nd antibody only) has low background whereas proliferating cells (I) show a strong T signal (red) in the nuclei of all cells, and in the cytoplasm of an anaphase cell (linked arrows). In contrast to BrdU, all cells (J) have only faint T signals at 2 days (2% serum, 37.5°C). Hematoxylin counterstained.

