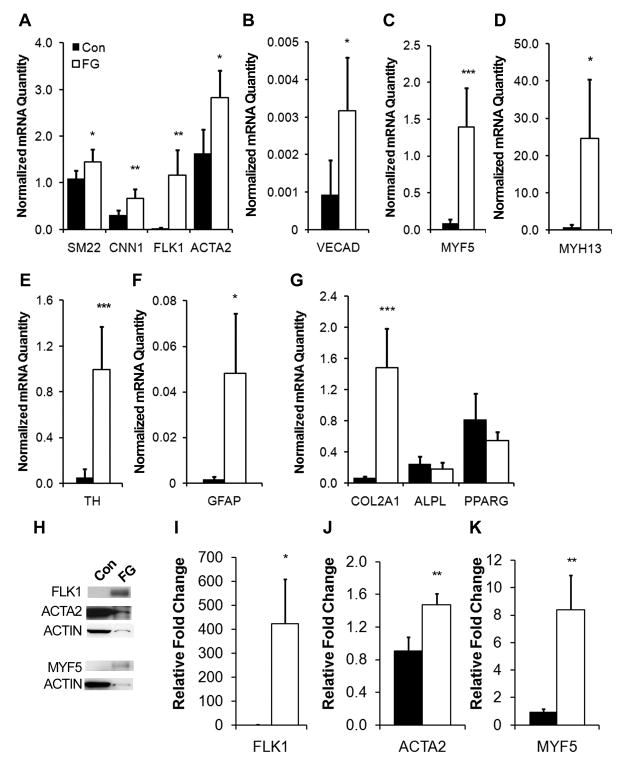
Fig 1. Mesenchymal stem cell (MSC) phenotype on fibrin-coated surfaces.
Real-time PCR data shows the differential gene expression after 5 days, as quantified as normalized mRNA quantity, for phenotypic markers comprising vasculogenic (A–B), myogenic (C–D), neurogenic (E–F), chondrogenic (G), osteogenic (G), and adipogenic (G) lineages. Immunoblots depicting FLK1, ACTA2, MYF5, and total actin protein expression (H) are shown and quantified by densitometry (I–K). Error bars indicate standard deviation. Con represents control tissue culture substrate and FG represents fibrin-coated substrates. * P<0.05, **P<0.01, ***P<0.001 (n≥3).

