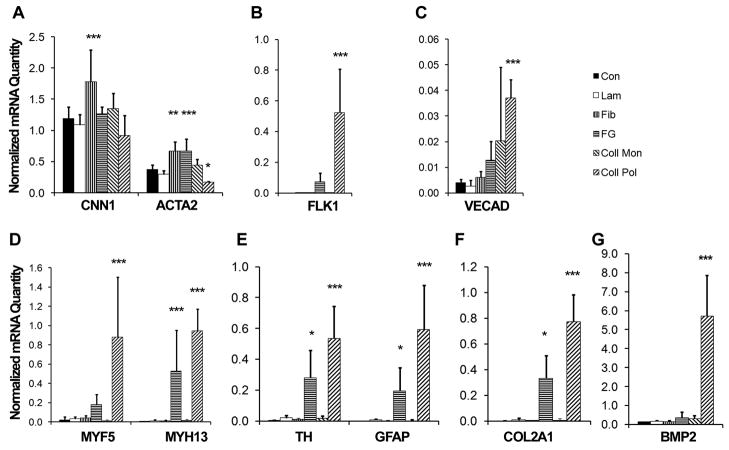
Fig. 4. Effect of ECM on MSC differentiation markers after 2 days.
Real-time PCR data shows the differential gene expression for phenotypic markers when MSCs were cultured on laminin (Lam), fibronectin (Fib), fibrin (FG), collagen monomer (Coll Mon), or collagen polymer (Coll Pol). The phenotypic markers consisted of those comprising vasculogenic (A–C), myogenic (D), neurogenic (E), chondrogenic (F), and osteogenic (G) lineages. The PCR data is expressed as a normalized abundance to the control tissue culture substrate (Con) for markers comprising multiple lineages. Error bars represent standard deviation.). * P<0.05, **P<0.01, ***P<0.001 when compared to Con group (n≥3).

