
Fig. 3.
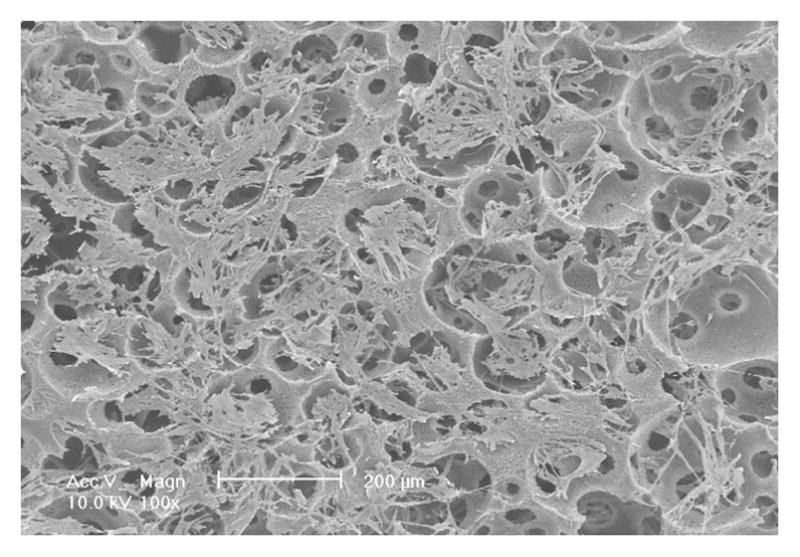
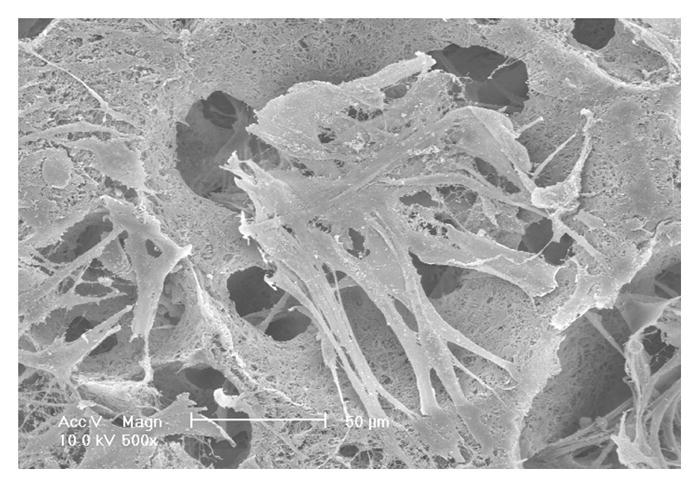
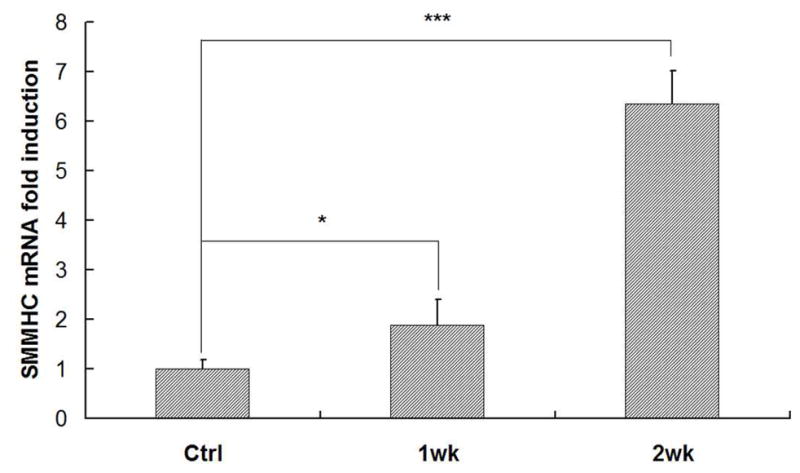
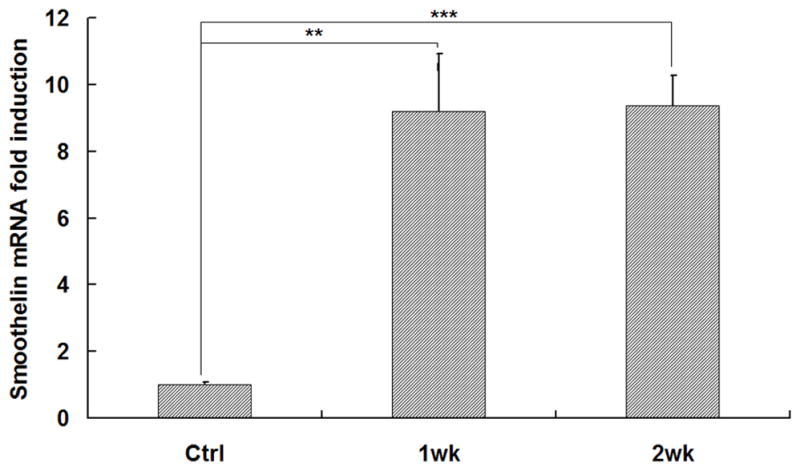
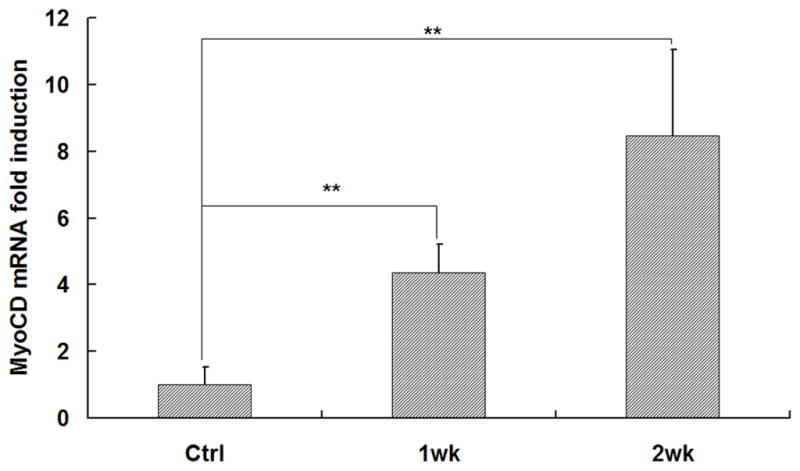
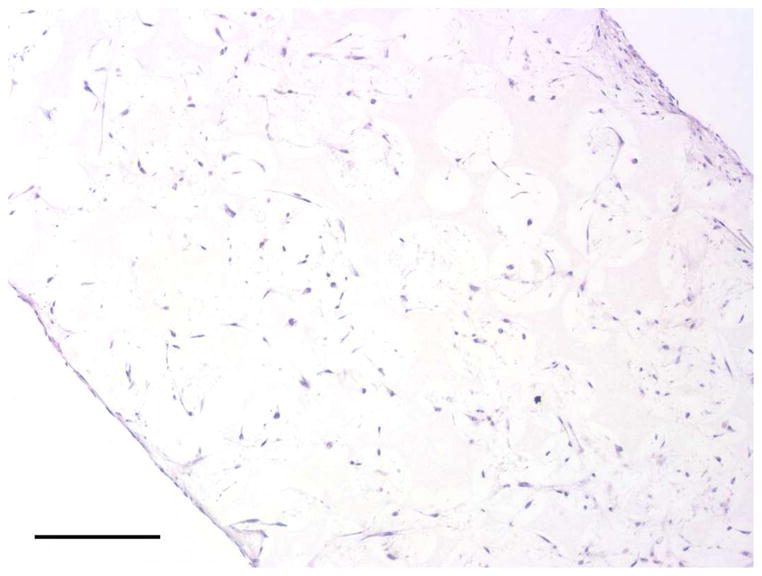
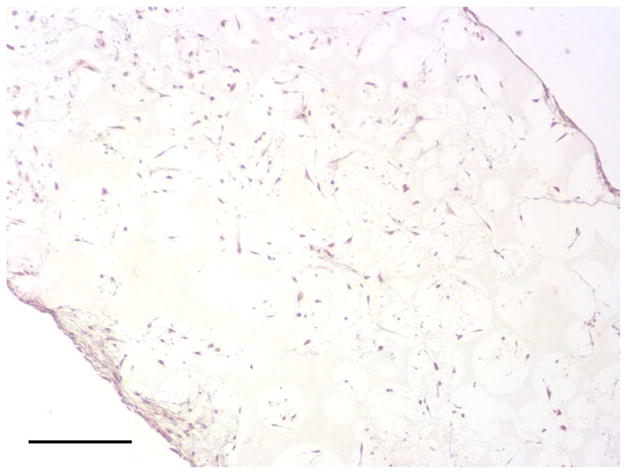
In vitro culture of HASMCs on a 3D NF scaffold. SEM micrographs of the cell-scaffold construct after 24 hr of cell seeding and culture (A, B). Gene expression of SMC specific markers was analyzed after 1 wk and 2 wk of culture on scaffolds, compared to monolayer control culture (C–E). H-E staining (F) and Masson’s trichrome staining (G) of sections of constructs cultured for 2 wk. Scale bar: 200μm. * P<0.05, ** P<0.01, ***P<0.001.