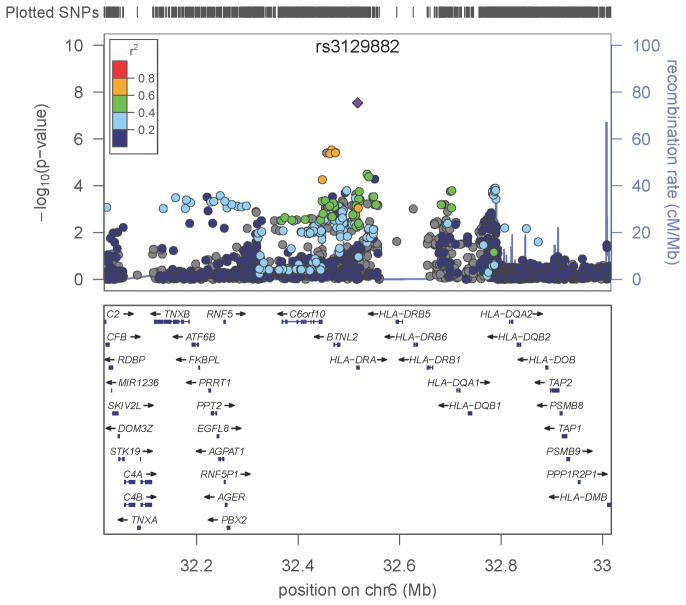
Figure 2. Signals of PD-association within HLA.
A one megabase (MB) region was defined centered on the association peak, rs3129882 in intron 1 of HLA-DRA, spanning from base pair (BP) position 32,017,508 to 33,017,508. The top panel shows all SNPs in this region plotted according to the significance of their association with PD and color-coded according to their linkage disequilibrium (r2) with the most significant SNP, rs3129882. Note that rs3129882 is not strongly correlated (defined as r2≥ 0.8)with any other HLA variant. The LocusZoom software used here calculates r2 using the HapMap CEU data. SNPs shown in grey were on the Illumina OMNI chip but not on HAPMAP thus r2 was not calculated with this method; however, using the Haploview software and the NGRC data to estimate r2, none of the variants was strongly correlated with rs3129882 (r2<0.6, Supplementary Fig. 6). The bottom panel shows the genes in the region, including the closely linked polymorphic HLA-DRB and DQB loci, and DRA, DRB5, and DRQA2 whose expression is correlated with the variation at rs3129882.

