Figure 3.
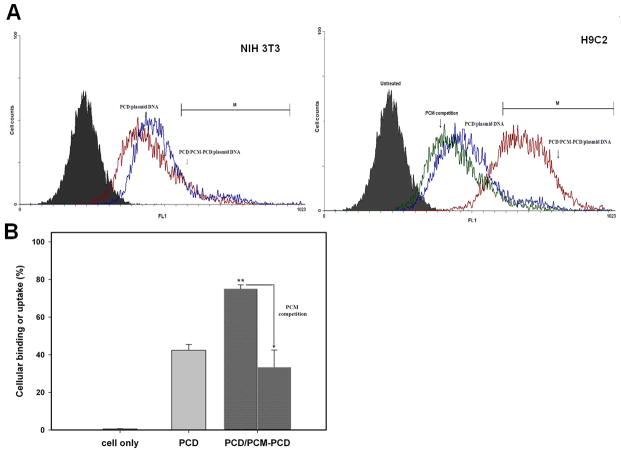
Cellular binding or uptake assay and competition experiment by flow cytometry. (A) Fluorescence histogram intensity of averaged cellular binding and uptake with YOYO-1-labeled pDNA in NIH 3T3 cells and H9C2 cells, and plotted as fluorescence intensity vs. count plot. For competition assays with free ligand to H9C2 cells, excess free ligand was incubated with the cells before treatment with nanoparticles. (B) Cellular binding % gated in M1 region in H9C2 cells. Each data point represents the mean ± standard deviation (n = 3). ** = P < 0.01

