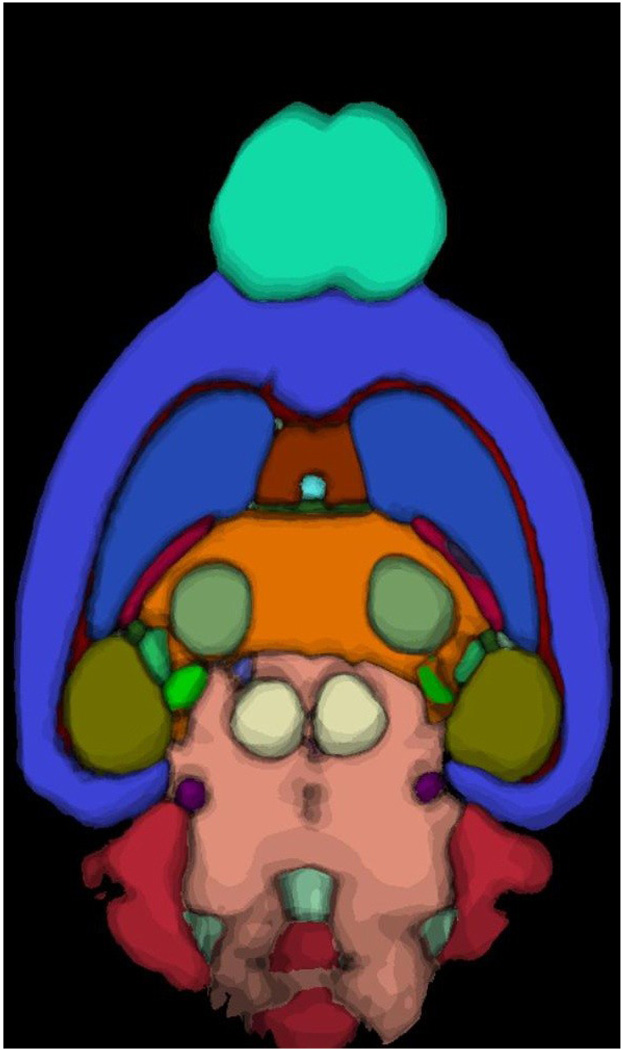
Figure 4.
A dorsal slice from MLA shows the maximum likelihood labeling for each pixel in the image. Pixels are color-coded, so the color defines the structure for which the pixel has the highest probability. The shading of the colors depicts the fact that the maximum probability at the boundary between structures decreases as one moves across the boundary.

