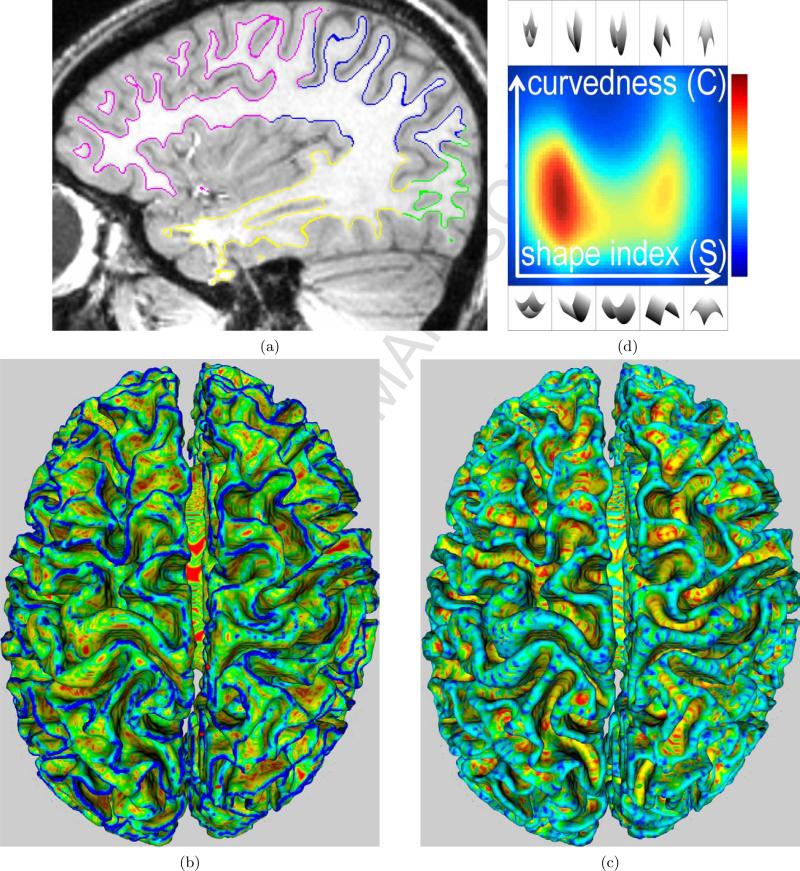
Figure 1.
(a) A sagittal slice of a head MR image overlapped with the cortical surface . (b) Curvedness values C(m) painted on (red→blue ≡ zero→high). In this figure, red areas are almost flat and blue areas are highly curved. (c) Shape-index values S(m) ∈ [−1, 1] painted on (red→blue ≡ −1 → 1). In this figure, red/yellow areas are concave, blue/cyan areas are convex, and green areas are saddles. (d) Proposed descriptor (blue→red ≡ 0 → 1 probability; colormap shown on right). For all plots of in this paper: horizontal axis ≡ S, vertical axis ≡ C. The illustrations of local surface patches, at the top and bottom of this figure, depict patches for the entire range of possible S values; corresponding patches at the top and bottom have the same S value; all patches at the top have the same C value that is higher than the C value for all the patches at the bottom; the left half of the domain comprises concave patches, while the right half comprises convex patches.

