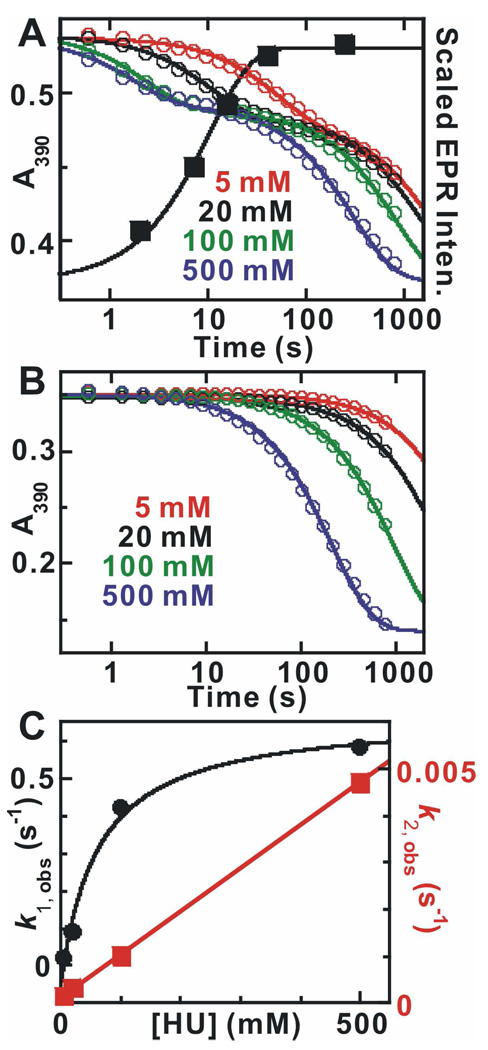
Figure 3.
(A) Kinetics of the absorbance changes at 390 nm (left y-axis) during the reaction of MnIV/FeIII–β2 with HU in the presence of α2, CDP, and ATP at ambient temperature (22 ± 2) °C and relative intensities of the EPR signal characteristic of the homogeneous MnIII/FeIII–β2 state (right y-axis). The reaction was carried out by mixing a solution containing 400 µM β monomer (0.75 equiv MnIV/FeIII), 800 µM α monomer, 20 mM DTT, and 2 mM ATP with an equal volume of reaction buffer containing 8 mM CDP and HU at a concentration giving the values of [HU] listed in the figure (after mixing). Solid lines overlaid are fits of the data to equation 1 with two exponential phases. The black solid squares are the EPR signal intensities extracted from the spectra shown in Figure S1. The solid line is the fit according of a single exponential phase to the data, which gives a rate constant of (0.10 ± 0.03) s−1. (B) Kinetics of the reaction of MnIV/FeIII–β2 with HU. The reaction was initiated in the same fashion above but in the absence of α2, CDP, ATP and DTT. (C) Dependence of the apparent first-order rate constants for the reactions on the concentration of HU. k1, obs plotted in black solid circles was extracted from the fast phase in A and the overlaid solid line is the hyperbolic fit to the data, which gives a limiting reduction rate constant (asymptote of hyperbolic fit) of (0.7 ± 0.1) s−1. k2, obs plotted in red solid squares was extracted from the reactions in B. The linear fitting gives the second-order rate constant (slope) of (9.0 ± 2.0) × 10−3 M−1s−1.

