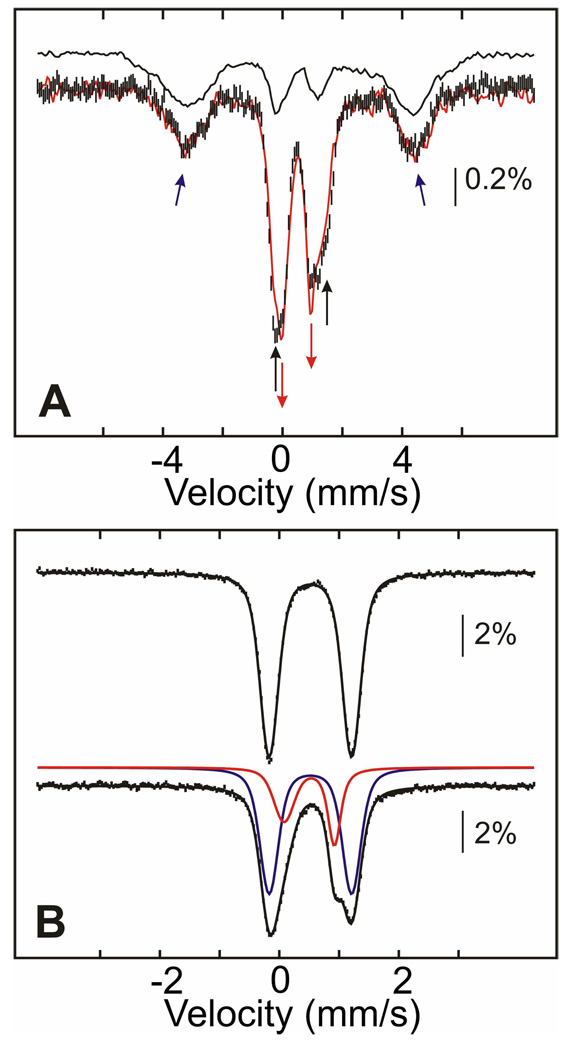
Figure 4.
Mössbauer spectra illustrating the different outcomes of the reaction of MnIV/FeIII–β2 with HU. (A) 4.2-K/53-mT Mössbauer spectra of samples in which MnIV/FeIII–β2 (800 µM β, 0.75 equiv MnIV/FeIII cluster) was reacted with 20 mM HU at ambient temperature for 1 min (black hashed vertical bars) or 10 min (red solid line) in the presence of 1.2 mM α, 10 mM DTT, 1 mM ATP, and 10 mM CDP. The black solid line is the spectrum of the heterogeneous MnIII/FeIII-β2 state (49). The black and red arrows indicate the conversion of the MnIV/FeIII form to the new FeIII-containing complex. The blue arrows indicate the outer lines of the magnetically split sub-spectrum of the MnIII/FeIII cluster (~45% of the total intensity). The amounts of the MnIII/FeIII cluster in the two samples are identical within the experimental uncertainty. (B) 4.2-K/zero-field Mössbauer spectra of samples prepared by treatment of MnIV/FeIII-β2 (top) with 20 mM HU for 30 min at ambient temperature (bottom). The solid lines on top are simulations as indicated in the text. The blue and red lines represent the contribution of the MnIV/FeIII cluster and the new FeIII-containing, diamagnetic species, respectively.

