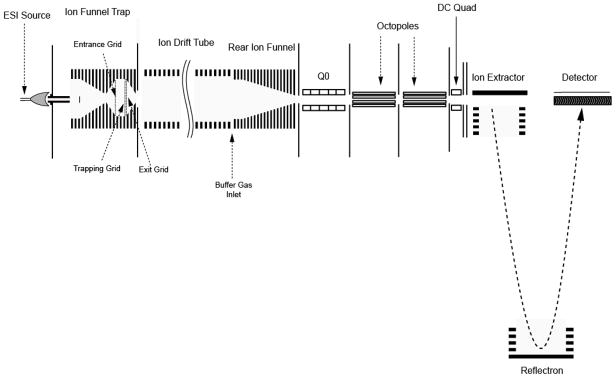
Figure 1.
Schematic diagram of the IMS-TOFMS instrument. Ion accumulations in the ion funnel trap (IFT) and signal encoding were accomplished by modulating potentials applied to the front, trapping and exit grids of the IFT. The entrance grid represents the IFT entrance gate, while the trapping and exit grids encompass the IFT exit gate. Q0 is the segmented quadrupole designed to interface the IMS instrument to an Agilent 6210 TOFMS.

