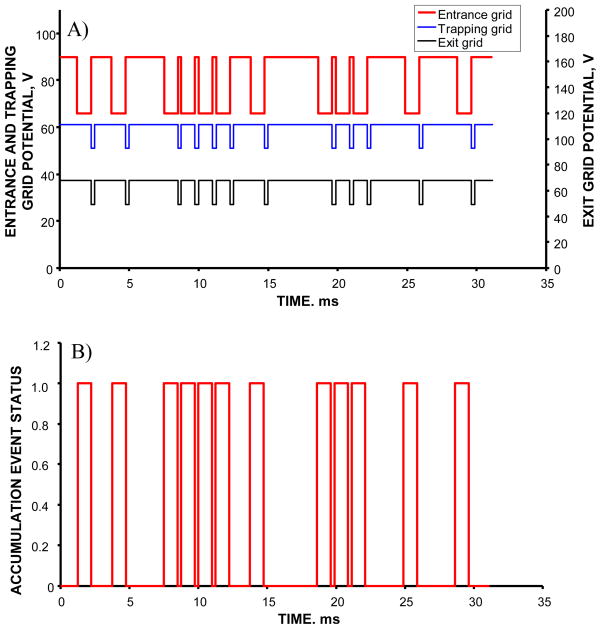
Figure 2.
A) Timing diagrams of potentials applied to the entrance, trapping and exit grids. The entrance grid is referred to as the IFT entrance gate, while a combination of the trapping and exit grids constitutes the IFT exit gate. The diagrams show a small portion of the signal encoding with a 6-bit PRS. For each grid, higher potential corresponds to ion beam blocking, while lower potential accomplishes ion transmission. Note that lower potentials at the exit gate correspond to ion releases to the IMS drift tube, while lower potentials at the entrance gate enable ion accumulation events in the IFT. B) Accumulation events as a function of the elapsed time. The events are correlated with potential distributions in A. ‘1’ corresponds to ion accumulation in the IFT, while ‘0’ occurs during ion beam blocking at the entrance gate and ion gating to the IMS drift tube.

