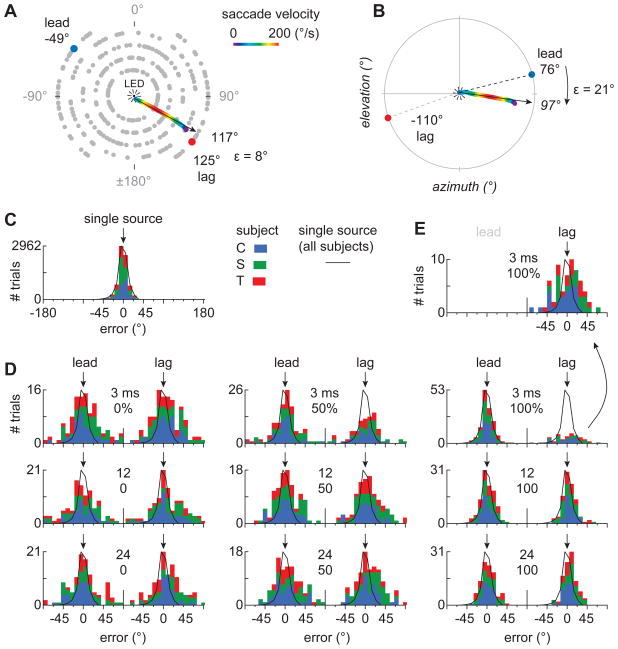
Figure 2. Head saccades.
(A) Speaker locations used in head-saccade experiments. Gray dots mark the possible speaker locations. At the start of a trial, the owl was required to fixate an LED (center) before a speaker or speaker-pair was activated. In trials with lead/lag pairs, the two speakers were diametrically opposed across the center of the array. The multicolored lines in A and B show sample saccades and their trajectories (arrow). Colors represent the angular velocity of the saccade. (C) Distribution of head-aims relative to single sources (0°) in three owls (C, S, and T). Each color represents a different bird. The black line is the normalized average distribution of head-aims for all 3 subjects. (D) Distributions of head saccades in precedence-effect trials for OEDs of 3, 12, and 24 ms and modulations of 0, 50, and 100%. The locations of the lead and lag sources are indicated by arrows (0°). The distributions converge at the center of the abscissa because the speakers were separated by 180°. The distribution of lag-directed saccades for an OED of 3 ms is magnified and re-plotted in (E).

