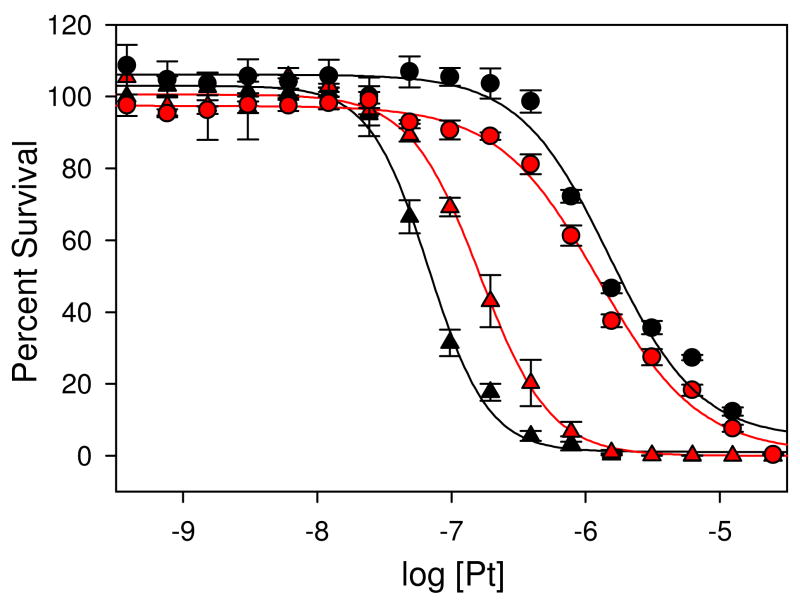
Figure 2.
Drug–response curves for cell proliferation assays with NCI-H460 cells treated with PT-ACRAMTU (triangles) and cisplatin (spheres) in the absence of netropsin (black traces) and in the presence of 25 μM netropsin (red traces). The plotted data are averages of three independent experiments (triplicates) for PT-ACRAMTU and two independent experiments (triplicates) for cisplatin. Error bars represent ± standard errors.

