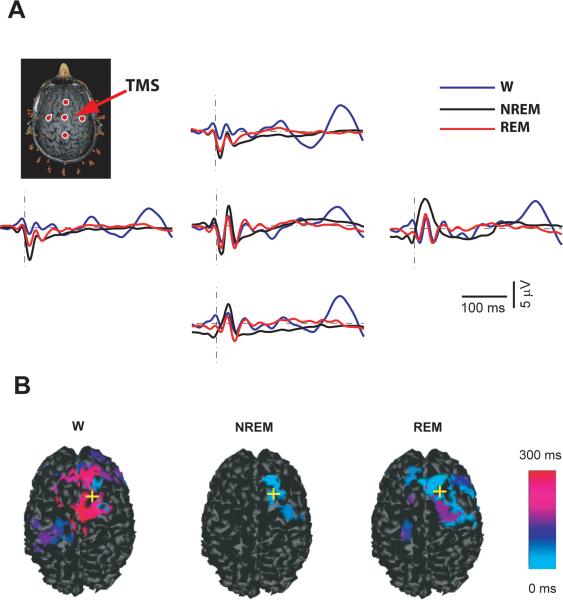
Fig. 3.
(A) The TMS-evoked potentials recorded from one subject, in whom a long stretch of REM sleep could be recorded, are displayed (blue: wakefulness, black: NREM sleep, red: REM sleep). The traces were recorded from the channels indicated by red dots in the upper left panel, where the site of stimulation on the subject's MRI is also indicated by (red arrow). (B) Spatiotemporal cortical maps of TMS-evoked cortical activation during wakefulness, NREM and REM sleep. For each significant time sample, maximum current sources were plotted and color-coded according to their latency of activation (light blue, 0 milliseconds; red, 300 milliseconds). The yellow cross marks the TMS target on the cortical surface. During REM sleep, the resumption of TMS-evoked fast oscillations was associated with a partial recovery of cortical effective connectivity.

