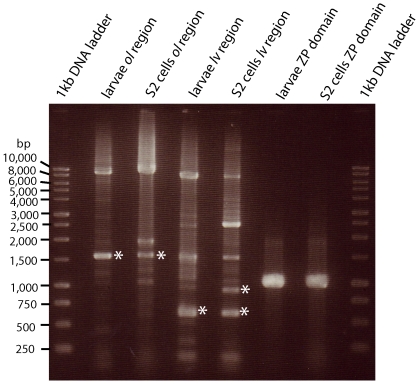
Figure 6. Gel showing RT-PCR products from the dumpy gene in 3rd instar larvae and S2 cells.
Primers flanking the ol and lv regions and the ZP domain that were used to generate these products are shown in Table S2. Bands marked with asterisks were excised and sequenced.

