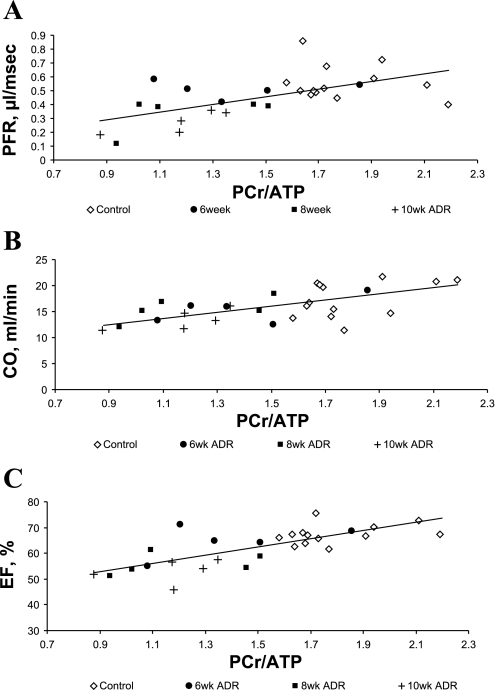
Fig. 5.
A: relationship between in vivo cardiac PCr/ATP and peak filling rate (PFR) [maximal rate of volume change (−dV/dtmax)]: y = 0.27x + 0.05, R2 = 0.35, R = 0.59, P < 0.001. B: relationship between in vivo cardiac PCr/ATP and cardiac output (CO): y = 5.5x + 7.7, R2 = 0.38, R = 0.62, P < 0.001. C: relationship between in vivo cardiac PCr/ATP and ejection fraction (EF): y = 15.4x + 39.1, R2 = 0.54, R = 0.73, P < 0.0001.

