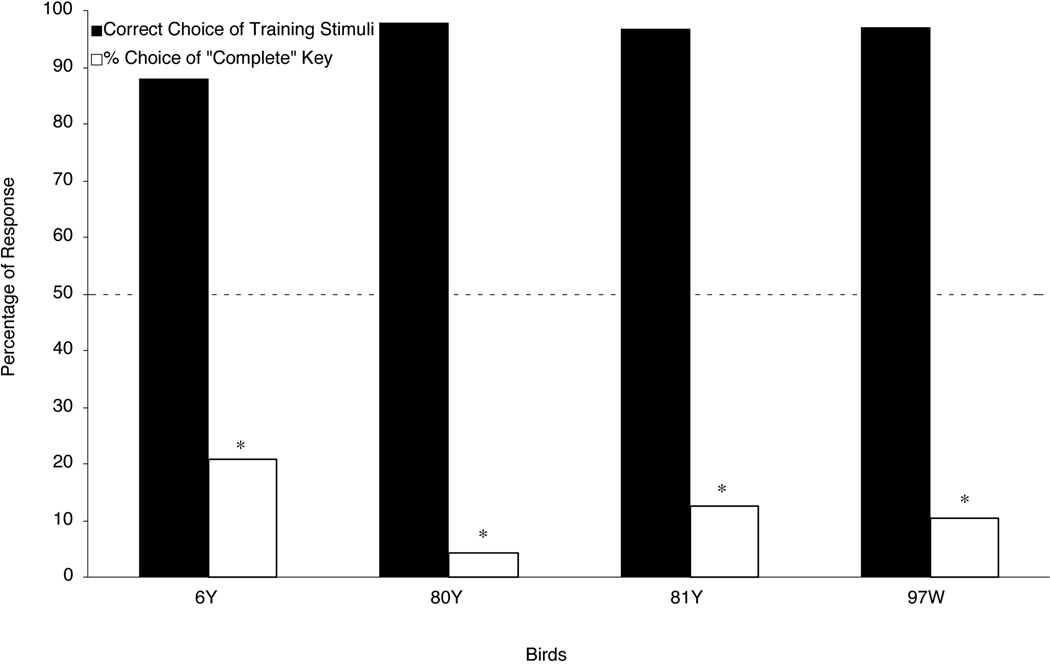
Figure 3.
The percentage of each bird’s choice responses in Experiment 1 testing. Filled bars show the percentage of correct responses to the training stimuli. Open bars show the percentage of choices on Occluded testing trials made to the “complete” report key. The dashed line shows chance responding (50%). The asterisks represent choice scores that were significantly below chance (p < .05).

