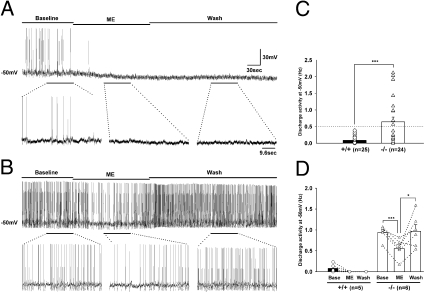
Fig. 5.
Discharge activities at a depolarized membrane potential in the μOR-positive GABAergic neurons of the vlPAG. (A and B) Firing-pattern changes for three periods from (A) the wild-type LTS-positive μOR-positive and (B) α1G−/− LTS-negative μOR-positive GABAergic neurons are shown. The portions of the traces underlined by horizontal bars in A and B were analyzed and presented in D. The same portions of the traces are illustrated with an expanded time scale below each trace. (C) The bar graph illustrates the basal-discharge activities of wild-type (0.09 ± 0.02 Hz) and α1G−/− (0.64 ± 0.14 Hz) neurons. (D) Changes of discharge activity (A and B) in the wild-type (basal: 0.08 ± 0.05 Hz; ME: 0 Hz; Wash: 0 Hz) and α1G−/− (basal: 0.942 ± 0.07 Hz; ME: 0.56 ± 0.09 Hz; Wash: 0.97 ± 0.16 Hz) neurons. Wild type vs. α1G−/−: F1,9 = 66.536, P < 0.001, RM ANOVA. Paired t test (*P < 0.05; ***P < 0.001).

