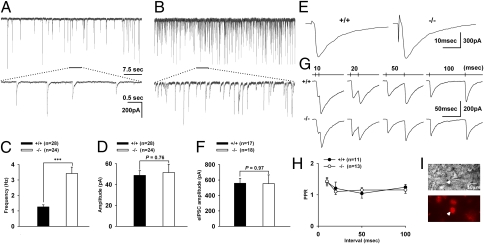
Fig. 6.
Characterization of GABAergic sIPSC, eIPSC, and PPR of PAG-RVM projection neurons. (A and B) Examples of sIPSCs recorded in the wild-type (A) and α1G−/− (B) projection neurons. Horizontal bars indicate the trace portions that were illustrated with an expanded time scale beneath. (C) The bar graph illustrates the frequency of sIPSC in the wild-type (1.26 ± 0.13 Hz) and α1G−/− projection (3.42 ± 0.42 Hz) neurons. The frequency of sIPSC was increased in α1G−/− without changes in the amplitude (48.84 ± 4.45 pA and 51.51 ± 7.98 pA for wild-type and α1G−/−, respectively) (D). (E) Representative traces showing the eIPSC in the wild-type (Left) and α1G−/− (Right) projection neurons. (F) The peak amplitude of eIPSC in the wild-type (558.65 ± 61.94 pA) and α1G−/− projection (553.83 ± 112.34 pA) neurons showed no difference. (G) Paired-pulse stimulations elicited eIPSCs that show PPF in wild-type (Upper) and α1G−/− projection (Lower) neurons. The interstimulus intervals are indicated on the top of the traces. (H) The PPR was not significantly different between the two genotypes. (I) The DIC image (Top) and retrograde dye image (Bottom) of a patched neuron. Arrowheads indicate a projection neuron.

