Fig. 3.
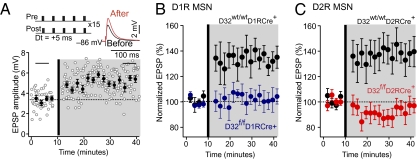
Corticostriatal LTP is disrupted in DARPP-32 conditional KO mice. (A) LTP was induced by a positive pairing timing protocol as shown at the upper left. Plots show EPSP amplitude as a function of time. The dashed line shows the average EPSP before induction. The induction was performed at the vertical bar. Filled circles show the averages of 12 trials (±SEM). The traces in the upper right show the average EPSP before induction (black trace) and after induction (red trace), from the time periods identified by the horizontal black bars on the plot. Pre, presynaptic; post, postsynaptic. (B and C) D32f/fD1RCre+ and D32f/fD2RCre+ mice were bred to D1R- and D2R-EGFP mice, respectively, to identify D1R and D2R expressing MSNs. EGFP-positive MSNs from D32wt/wtD1RCre+ (B) and D32wt/wtD2RCre+ (C) mice were used as controls and displayed significant LTP. LTP induction was disrupted in EGFP-positive MSNs from D32f/fD1RCre+ mice (B) and D32f/fD2RCre+ mice (C). (D1R MSNs: n = 5 per genotype, P < 0.05; D2R MSNs: n = 5–6 per genotype, P < 0.05, Mann–Whitney rank sum test).

