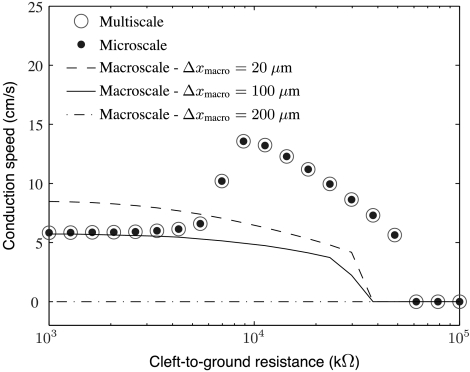
Fig. 5.
A plot of conduction speed versus cleft-to-ground resistance for several ephaptic models and levels of resolution. The microscale and multiscale models show a nonmonotonic profile of conduction speed versus cleft-to-ground resistance, known as the ephaptic effect. In contrast, the macroscale simulations do not capture this effect at resolutions of 20 μm, 100 μm, or 200 μm. In these simulations, gap-junction levels are at 1% of their normal value of 666 mS/cm2, and 90% of Na+ channels are localized to the ends of cells.

