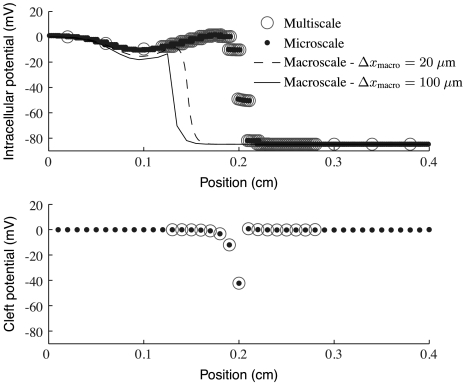
Fig. 6.
A plot of intracellular and cleft potentials at a fixed time for several different ephaptic models with gap-junctional coupling at 1% of normal and Rc = 8.85·103 kΩ. (Top) Intracellular potential for each model; (Bottom) cleft potential only for the multiscale and microscale models. The macroscale cleft potentials are omitted for clarity. Note that the cleft potentials for the multiscale model are shown only in the resolved region, as the model assumes them to be identically zero everywhere else. Observe that the multiscale and microscale models agree quite well. The macroscale model does not agree with them for either grid spacing. Note that 20 μm is the spacing used by the microscale simulations and the microscale part of the multiscale simulations.

