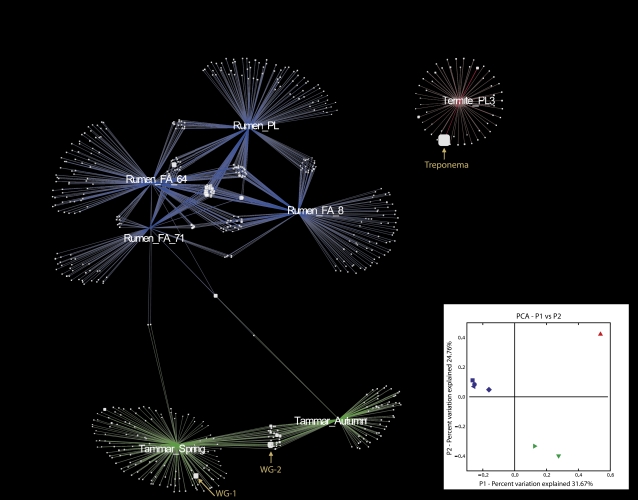
Fig. 1.
OTU network map showing OTU interactions between all rarefied samples from the Tammar wallaby (spring and autumn), rumen, and termite. Lines radiating from samples Rumen _FA_8, Rumen_FA_64, Rumen_FA_71, and Rumen_PL are colored blue (fiber-associated fraction and pooled liquid-associated, respectively, from ref. 13), Termite_PL3 colored red [termite lumen study (12)] and Tammar_Spring (T1) and Tammar_Autumn (T2) colored green (present study) are weighted with respect to contribution to the OTU. OTU size is weighted with respect to sequence counts within the OTU. (Inset) The first two principal coordinate axes (PCoA) for the unweighted UniFrac analysis colored by host animal: Rumen (FA_8, ■; FA_64, •; FA_71, ◆; PL,  ) blue; Termite (▲) red and Tammar (Spring,
  ; Autumn,▼) green. For complete inventory and comparisons between the two Tammar wallaby sample dates at an OTU definition (SONS analysis), see Table S2.

