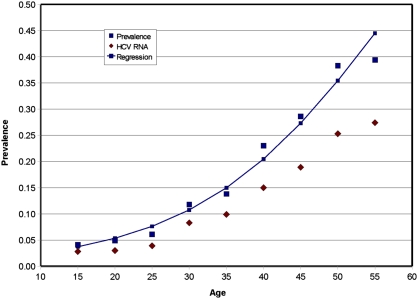
Fig. 3.
Prevalence of anti-HCV antibody positive and the prevalence of HCV RNA positive by 5-y age groups from the EDHS national sample (26). This graph was prepared from data abstracted from the EDHS national sample (26). The line was fitted by logistic regression for anti-HCV antibody prevalence. Logistic regression: χ2 = 1177.97, df = 1, SE = 0.0024, P = 0.000, r2 = 0.96, and 1/e(– α – β x), where α = −4.4 β = 0.0758.

