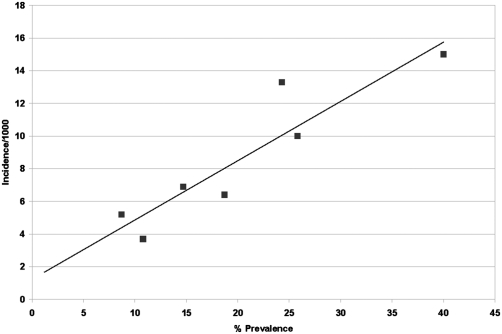
Fig. 4.
Relationship between estimated incidence and overall HCV prevalence from six community cross-sectional studies (44–49). The age-specific prevalence was abstracted from each of six cross-sectional reports. Prevalence from the EDHS (26) was also included as a seventh observation. In turn, these data were used as described in Methods to generate an estimate of report-specific incidence, which can be seen in Table 2. Report-specific prevalence and incidence points were plotted on a linear x-y graph with percentage prevalence on the x axis and incidence per 1,000 per year on the y axis. Linear regression: α + βx, where α = 1.23 and β = 0.363, r2 = 0.85 was the best fit and demonstrates an internal validation of the model used to generate a national incidence estimate.

