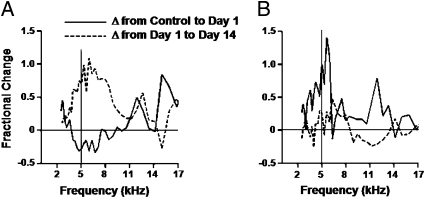
Fig. 3.
Ascending auditory input does not predict plasticity in A1 regions. (A) Fractional increase in response strength from control group to 1-day group (solid line) and from 1-day group to 14-day group (dashed line) in recordings from the LF region. The solid vertical line indicates target frequency. There is a fractional change at 5 kHz: control vs. 1-day, −0.27 ± 0.11; 1-day vs. 14-day, 0.71 ± 0.37. (B) Change measures in the HF region. There is a fractional change at 13 kHz: control vs. 1-day, 1.01 ± 0.62; 1-day vs. 14-day, 0.25 ± 0.14.

