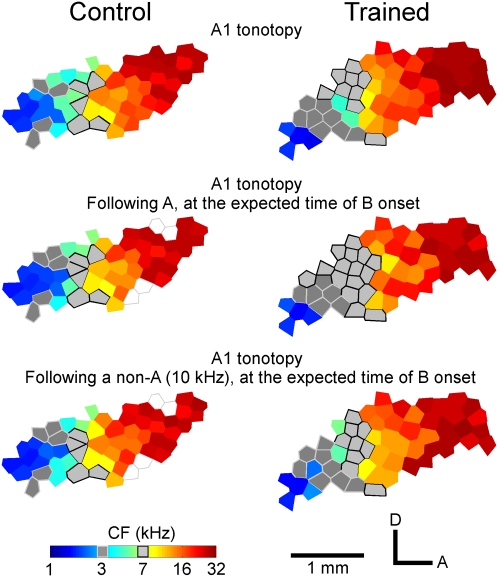
Fig. 2.
Representative auditory cortical CF maps. The color of each polygon indicates the CF for neurons recorded at that site (Bottom Left, scale). Dark or light-gray polygons indicate recording sites with CF values of 3 or 7 kHz ± 0.25 octaves. Unfilled polygons indicate that CFs were not determined at these sites. A, anterior; D, dorsal.

