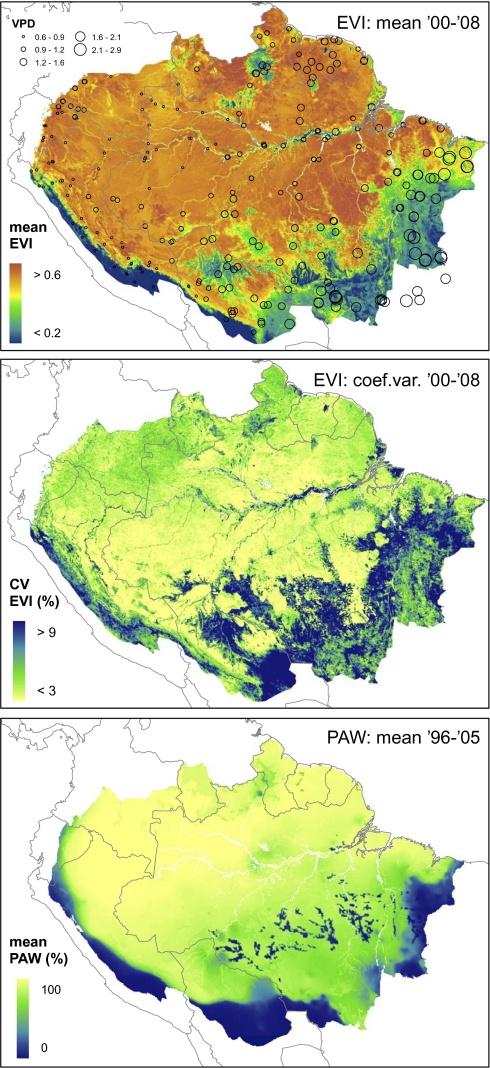
Fig. 1.
(Top) Average dry-season EVI across central South America for the period 2000–2008. Overlaid circles represent average VPD measured at 280 meteorological stations across the region for the period 1996–2005. (Middle) Coefficient of variation in annual EVI for the period 2000–2008. (Bottom) Average annual PAW at 10-m depth, expressed as a percentages of the maximum, for the period 1996–2005. Note that the scale here is amplified relative to Fig. 2.

