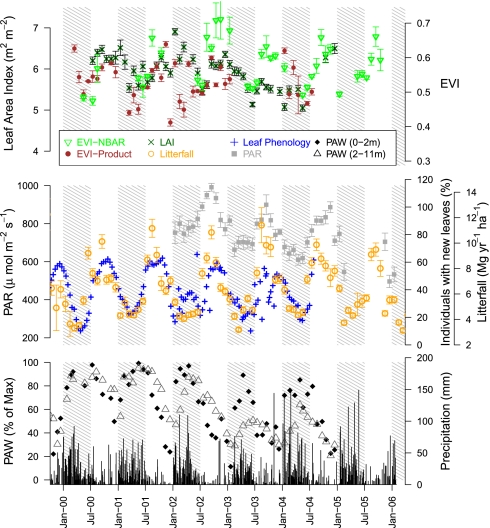
Fig. 4.
Temporal patterns of environmental and biophysical correlates of EVI. (Top) EVI derived from MODIS NBAR. EVI derived from the collection 5 MODIS product screened to include only good- or best-quality control flags and LAI (Methods). (Middle) Monthly PAR and bimonthly litterfall and new leaf production (Methods). (Bottom) PAW (% of maximum) at two depths (0–2 m and 2–11 m) and daily precipitation (in mm).

