Fig. 2.
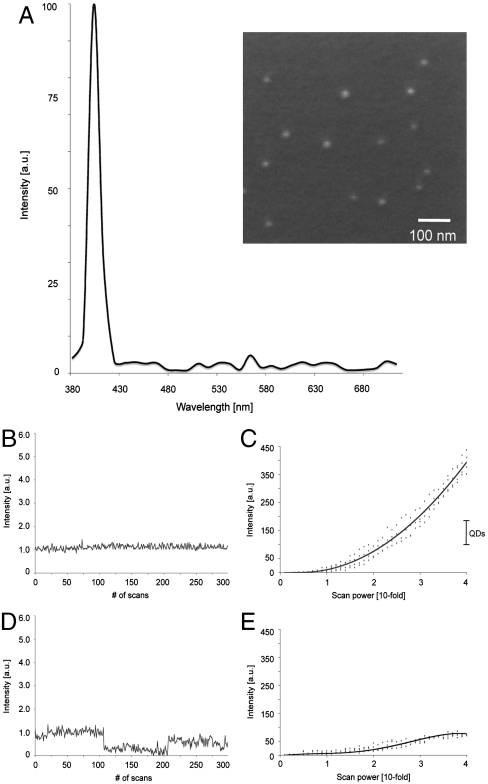
SHG nanoprobes signal properties. (A) Displayed is the normalized SHG signal spectrum of BaTiO3 nanocrystals of the size of around 30 nm (Inset, SEM picture of BaTiO3 nanocrystals) immobilized in 20% polyacrylamide gel (signal ranging from 380 to 710 nm) generated by tuning the excitation wavelength to 820 nm. (B) BaTiO3 nanocrystal immobilized in 20% polyacrylamide gel and illuminated with low-intensity levels of 820 nm light 300 times with a scanning speed of 20 frames/s. The SHG signal intensity of BaTiO3 is constant and does not display blinking. (C) BaTiO3 nanocrystals were immobilized in 20% polyacrylamide gel and rapidly illuminated with gradually increasing 820-nm light intensity. The SHG signal intensity of BaTiO3 nanocrystals increases quadratically. The dots show independent experimental results, whereas the line is a quadratic fit for BaTiO3 (n = 4). Bar shows direct comparison of the obtained intensity range of QDs (see E) when rapidly illuminated under comparable conditions with increasing (up to 40-fold) 820-nm light intensity. (D) Water-soluble CdSe/ZnS QD immobilized in 20% polyacrylamide gel and illuminated with low-intensity levels of 820-nm light 300 times with a scanning speed of 20 frames/s. In contrast to BaTiO3, the QD signal fluctuates displaying subblinking as well as major blinking. (E) QDs were immobilized in 20% polyacrylamide gel and rapidly illuminated with gradually increasing 820-nm light intensity. Signal saturation of the QD fluorescence occurs at very low-power levels. The dots show independent experimental results, whereas the line is a polynomial fit for QDs (n = 4).

