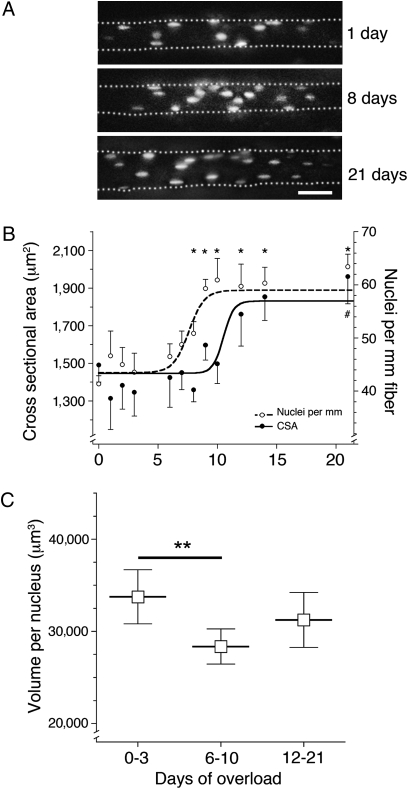
Fig. 1.
Effect of overload on fiber size and number of myonuclei studied in vivo. (A) Micrographs of fibers after overload. Nuclei are labeled with fluorescent oligonucleotides. Illustrations represent merged stacks of images from different focal planes. (Scale bar: 50 μm.) (B) Number of nuclei per millimeter and CSA. Each data point represents 5–24 fibers from a total of 36 animals. Symbols represent the mean ± SEM. A nonlinear fit using a Sigmoid dose–response curve was used for the increase in CSA and nuclei per millimeter, resulting in R2 = 0.13 and R2 = 0.29, respectively. *Nuclei per millimeter; #CSA significantly different from day 0 (P < 0.05). (C) Nuclear domains. Each symbol represents the binned time groups calculated from the dataset in B. **Statistical differences between the indicated time groups (P < 0.01).

