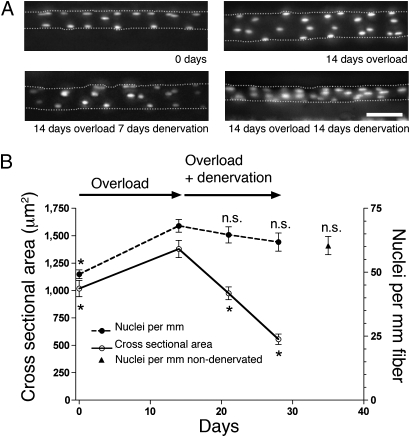
Fig. 2.
Effect of denervation on overloaded muscles studied in vivo. (A) Micrographs of fibers after overload and subsequent denervation. Nuclei are labeled with fluorescent oligonucleotides. Illustrations represent merged stacks of images from different focal planes. (Scale bar: 50 μm.) (B) Quantification of nuclei per millimeter of fiber length and CSA of single fibers after denervation of hypertrophied muscle. Each data point represents the mean ± SEM (n = 23–35 fibers from six to eight animals). Muscles were synergist-ablated and not denervated for 35 days (▲). *Statistical significance difference (P < 0.05). n.s., Nonsignificant difference from 14 days of overload.

