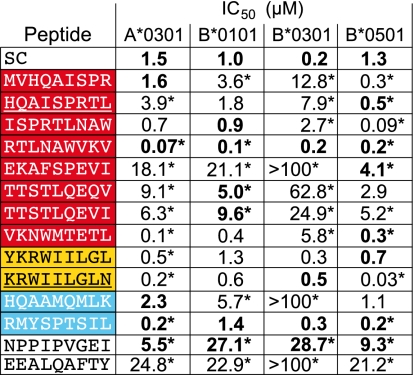
Fig. 3.
IC50 (μM) values of the different competitor peptides tested for Patr-A*0301, -B*0101, -B*0301, and -B*0501. The IC50 values in bold were determined from regression curves (Fig. S3) derived from pooled data from five individual experiments. For all other conceivable combinations, the IC50 values were derived from pooled data from three individual experiments. Previously described CTL epitopes are underscored (30). The color codes of the peptides correspond to the colors in Fig. 2. SC, standardized competitor (a peptide similar to the biotin-labeled indicator peptide). An asterisk indicates a significantly higher or lower binding affinity than the SC.

