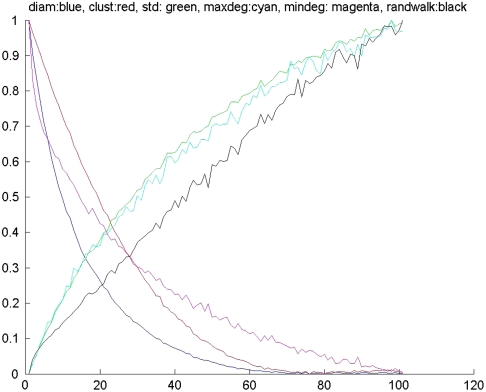
Fig. 2.
Structural properties of networks vs. rewiring parameter q. For each of many values of q (x-axis) ranging from 0–1 (corresponding to x = 100), we sampled 100 random networks from our generative model using that value of q, and computed a variety of structural measures. In order to permit plotting on common axes, each quantity is normalized by its maximum and minimum values across all q to lie between 0 and 1. The quantities network diameter (blue plot), clustering coefficient (red) and minimum degree (magenta) all decrease rapidly with increasing q; while the quantities maximum degree (cyan), standard deviation of degree (green) and ratio of largest to smallest degree (black, and which can be interpreted as the ratio of the largest to smallest probability in the stationary distribution of a random walk on the network) all increase rapidly with q. This plot permitted us to sample “interesting” values of q for our experiments. In particular, the response to all quantities is greater at smaller q, so we sampled more densely there.

