Fig. 3.
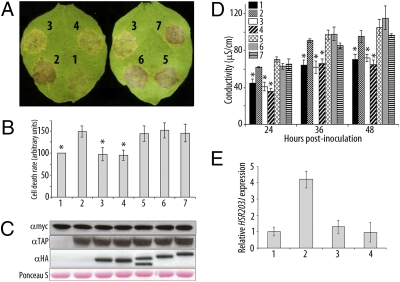
AtsPLA2-α negatively regulates HR development. Lanes: 1, AvrRpt2-myc alone or with: 2, AtMYB30-TAP; 3, AtMYB30-TAP+AtsPLA2-α-HA; 4, AtMYB30-TAP+AtsPLA2-α-H62Q-HA; 5, AtMYB30-TAP+AtsPLA2-β-HA; 6, AtMYB30-TAP+AtsPLA2-γ-HA; 7, AtMYB30-TAP+AtsPLA2-δ-HA. (A) HR development for each combination 3 dpi. Cell death was quantified by measuring the uptake of Evans blue 48 hpi (values are related to that of AvrRpt2-myc, which is set at 100%) (B) or electrolyte leakage at the indicated time points (D). Mean and SEM values are calculated from four independent experiments (three replicates per experiment). Statistical significance according to a Student's t test P value <10−7 is indicated by asterisks. (C) Western blot showing expression of AvrRpt2-myc, AtMYB30-TAP, and HA-tagged AtsPLA2 constructs. Ponceau S staining of the membrane confirms equal loading. (E) HSR203J transcript levels determined by Q-RT-PCR 48 hpi. Expression values are normalized by using the expression level of β-tubulin 4 and related to the value of HSR203J expression in leaves expressing AvrRpt2-myc, which is set at 1. Mean and SEM values are calculated from three independent experiments (three to five replicates per experiment).

