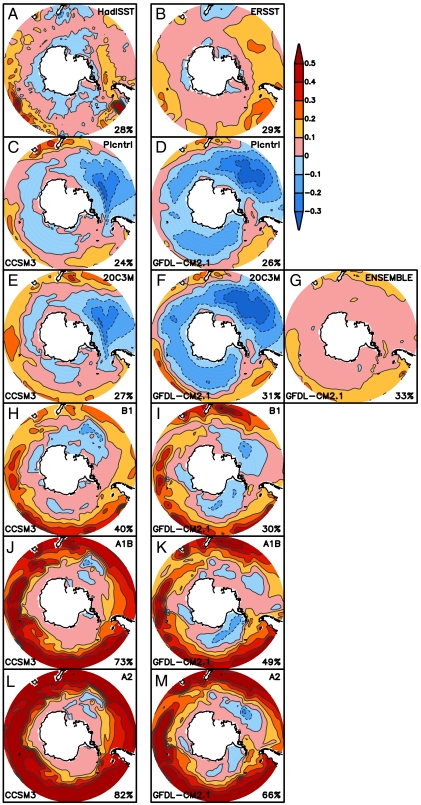
Fig. 1.
Spatial patterns of the first EOF mode of the area-weighted annual mean SST south of 40 °S. Observations: (A) HadISST and (B) ERSST for the period 1950–1999. Simulations of CCSM3 (Left) and GFDL-CM2.1 (Right): (C, D) 50-year PIcntrl experiment (natural forcing only), (E–G) 20C3M experiment for 1950–1999 (anthropogenic and natural forcings), (H–M) three scenarios (B1, A1B, and A2) for the 21st century.

