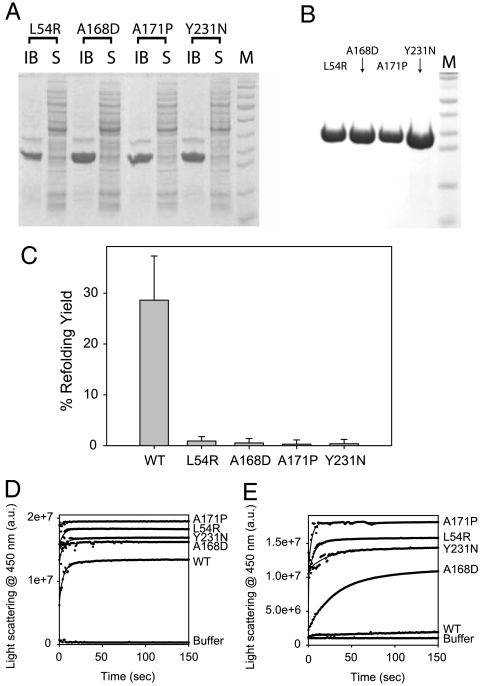
Fig. 3.
(A) SDS/PAGE of N-ABD mutants expression in E coli. IB and S represent the protein content expressed in inclusion bodies and in the solution phase respectively. Lane M shows the protein molecular weight markers. (B) SDS/PAGE of purified mutants. Lane M is the protein molecular weight markers. (C) Fraction of refolded protein of WT N-ABD and four disease-causing mutants from their unfolded states. (D and E) Aggregation kinetics of WT and mutants as measured by the right-angle light scattering. Panels D and E show the aggregation kinetics without and with 0.5 M L-arginine, respectively.

