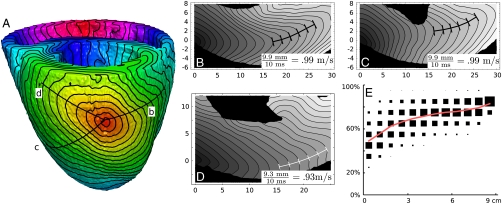
Fig. 4.
Isochrones for a wavefront on the surface of the heart (A) and in three sections through the wall (B)–(D) [marked by lines in (A)]. Isochrones in (A) are spaced 3.75 ms apart; isochrones in (B)–(D) are spaced 2 ms apart. (Isochrones in other slices are given in Fig. S7.) (E) gives a comparison of phys- and el-distance in the model of canine ventricles. The plot is a 2D histogram where data points represent randomly selected pairs of points in the ventricles. The x-coordinate is phys-distance and the y-coordinate is the ratio between the phys-distance and the el-distance. The area of each square is proportional to the number of data points in the corresponding region. To illustrate the change in ratio with increasing distance, the area of the squares in each column is normalized to be the same. The red line represents the mean ratio in each column. Each column represents between n = 59 and n = 4813 pairs of points, for a total of n = 28440 pairs. Selection of pairs is not completely independent; 2844 points were selected at random and for each point, 10 more points were selected at random as its counterparts.

