Fig. 3.
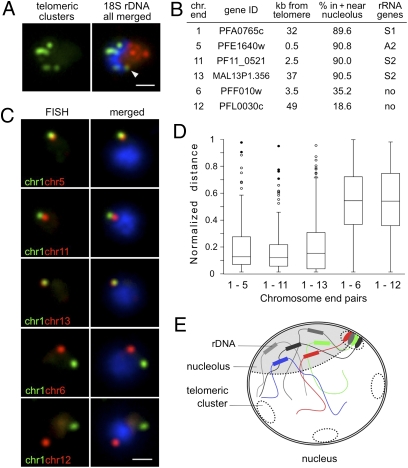
Nucleolar clustering of rDNA determines preferential association of rDNA-carrying chromosome ends. (A) Two-color DNA FISH of telomeric clusters (rep20, green) and 18S rDNA (red). The 18S rDNA FISH probe simultaneously detects the five rDNA units, which are clustered at one pole of the nucleus opposing the telomere clusters. White arrow points to the potential nucleolus-associated telomeric cluster. (B) Table presenting relative nuclear position of chromosome-ends used in C determined by immuno-FISH using PfNop1 antibodies (Fig. S3B). Gene ID numbers according to www.plasmodb.org. (C) Two-color DNA FISH analysis of chromosome end pairs. Chromosome end 1 is labeled in green, and chromosome ends 5, 11, 13, 6, and 12 are shown in red. In all images, the parasites are in ring-stage, and nuclei are shown by DAPI staining (blue). (Scale bar, 1 μm.) (D) Box plot representation of the normalized distance distributions. Normalized distance (ND) = separating distance of two signals/nucleus diameter (17). ND ranges from 0 to 1. Upper and lower limits indicate maximum and minimum values. Boxes denote 50% of distances [interquartile range (IQR)], and line within boxes indicates median. Filled circles (●) correspond to outliers (3 × IQR); open circles (○) are suspected outliers (1.5 × IQR). Numbers of nuclei analyzed are as follows: chr1–chr5, n = 112; chr1–chr11, n = 101; chr1–chr13, n = 118; chr1–chr6, n = 111; chr1–chr12, n = 93. Average nucleus diameter (±SD) for these experiments is 2.09 ± 0.22 μm. (E) Schematic recapitulating nucleolar clustering of dispersed rRNA genes and the nucleolus-associated telomeric cluster. We propose that this rDNA cluster impose physical constraints that may shape the global genome nuclear organization, with potential consequences for gene expression in P. falciparum parasites.

