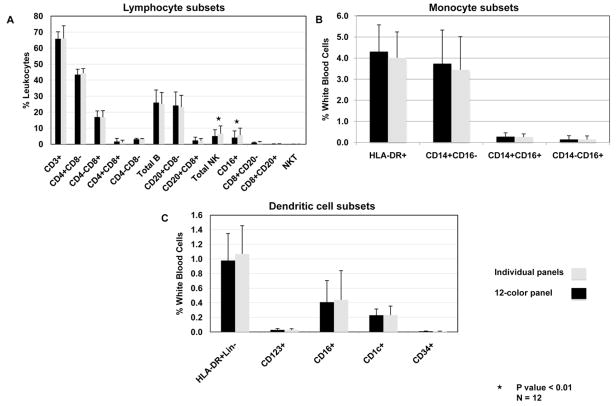
Figure 5. Comparison between individual lineage specific panels and the 12-color panel.
(A) Lymphocyte subsets, (B) monocyte subsets, (C) DC subsets. Individual lineage specific panels and a 12-color panel are described in Table 1B. Percentage median and Intra Quartile Range were calculated for each subset (n=12). Statistical significance was determined by using 2-tailed paired Students’ t-test where * P< 0.01.

