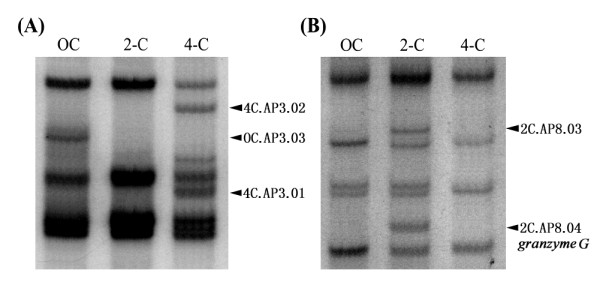
Figure 1.

Representative profiles of differential display mRNAs at various stages of mouse development. Polymerase chain reaction amplicons were amplified using the primer sets of (A) random primer H-AP3 and anchor primer T11G, and (B) random primer H-AP8 and anchor primer T11G. Mouse embryos at the unfertilized oocyte (OC), two-cell embryo (2-C), and four-cell embryo (4-C) stages were used in this study and are shown at the top of each lane. Differentially displayed bands are marked by arrows.
