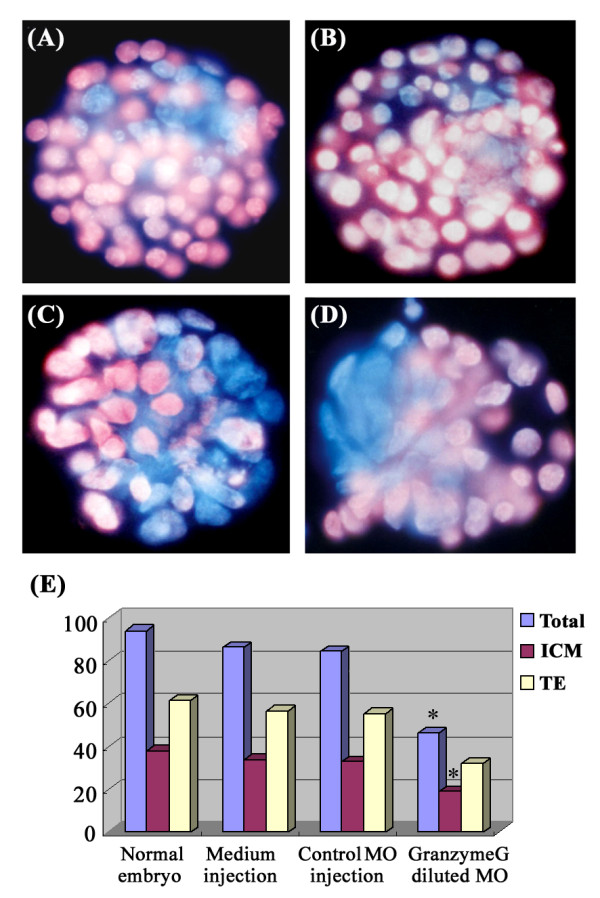
Figure 6.

The effect of inner cell mass (ICM) generation under low-dose anti-granzyme G morpholino treatment. Differential blastomere staining of in vitro cultured blastocyst embryos at day 3.5: (A) normally developed embryo without MO treatment; (B) control nonsense MO-injected embryo; (C, D) low-dose anti-granzyme G specific morpholino- (0.2 mM) injected embryos. The trophectoderm (TE) cells are stained with pink fluorescence, and the ICM cells are stained with blue fluorescence. Scale bar: 30 μm. (E) Quantitative analysis of the numbers of total cells, ICM cells, and TE cells plotted according to the different treatments: normal blastocyst (n = 10), M2 medium-injected embryos (n = 8), control MO-injected embryos (n = 12), and low-dose anti-granzyme G-specific MO-injected embryos (n = 12).
