
Figure 8.
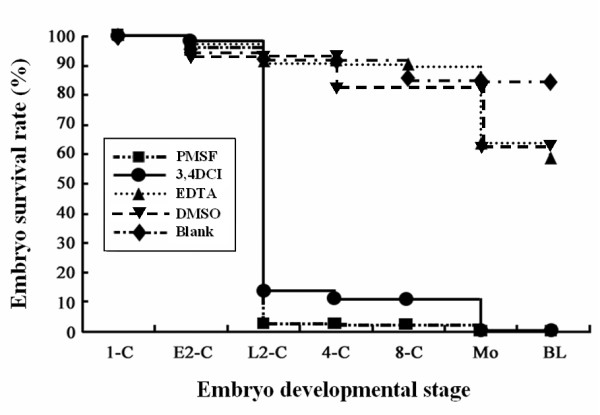
Embryo survival rate to pre-implantation developmental stages under different protease inhibitor treatments. Embryonic development potential was evaluated by adding 2 mM PMSF (n = 30) or 0.1 mM 3, 4-DCI (n = 28) for granzyme-specific serine protease inhibitors, 0.5 mM EDTA (n = 33) for non-granzyme-specific protease inhibitors, and 1% DMSO (n = 24) as a placebo control. A blank group (n = 30) that did not receive protease inhibitor was used to construct normal embryonic survival curves. The results are representative of three experiments.