Figure 4.
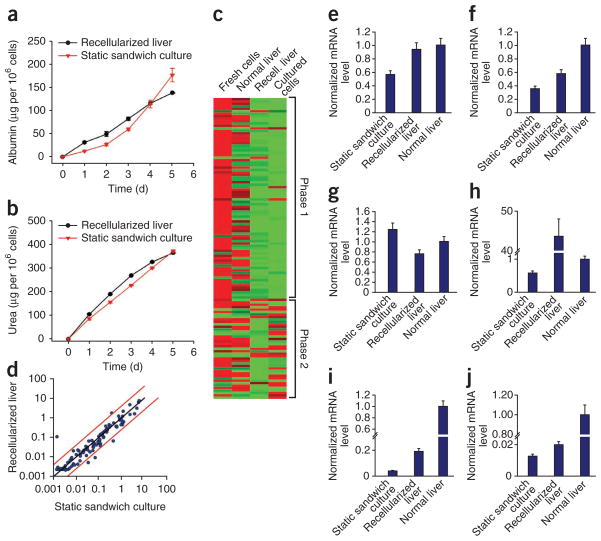
Hepatic function of the recellularized liver graft in vitro. (a,b) Albumin synthesis (a) and urea secretion (b) in comparison to static sandwich culture (P values are 0.0176 for albumin and 0.0017 for urea, by Friedman’s test). (c) Gene expression analysis of hepatocytes in the recellularized liver graft (2 d) compared to normal liver, fresh hepatocytes and sandwich culture hepatocytes (2 d) for phase 1 and phase 2 drug metabolism enzymes. (d) Scatter plot comparing gene expression of phase 1 and phase 2 drug metabolism enzymes at 2-d recellularized liver graft and cultured hepatocytes (P = 0.0499 by Friedman’s test). (e–j) Normalized gene expression of Cyp2c11 (e), Gstm2 (f), Ugt1a1 (g), Cyp1a1 (h), Adh1 (i) and Cyp3a18 (j). All error bars represent s.e.m. (n = 3).

