
Figure 1.
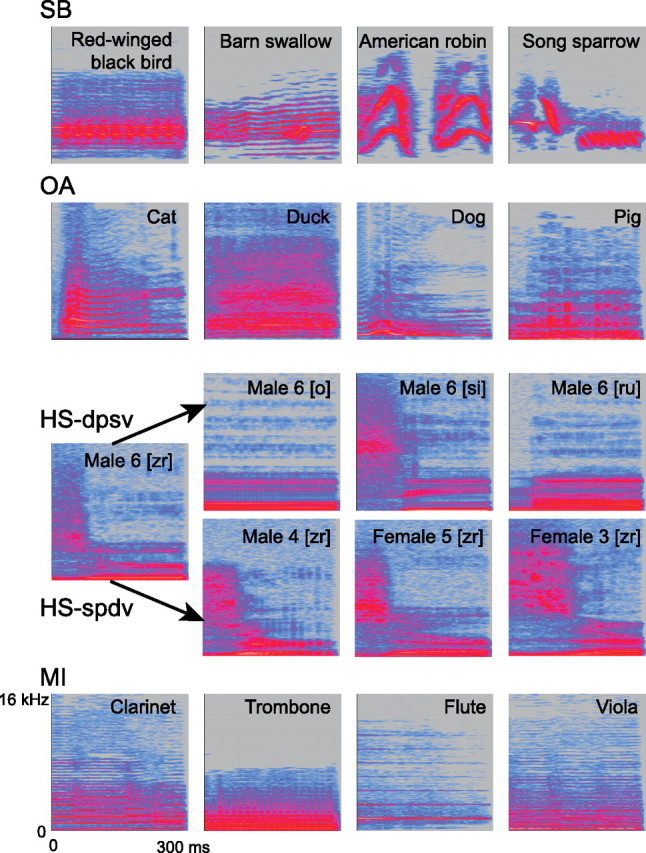
Example stimulus spectrograms for each category. Each row of four spectrograms represents an example trial. On each trial, four stimuli were presented, all from the same category (SBs, OAs, HS; HS-dvsp, HS-svdp, or MIs). Each stimulus was 300 ms in duration, as indicated by the length of the x-axis of the spectrograms. Frequency is plotted along the y-axis (0–16 kHz, linear scale), and stimulus intensity is denoted by color (grays and blues indicate low amplitude, pinks indicate high amplitude in dB).