Figure 2.
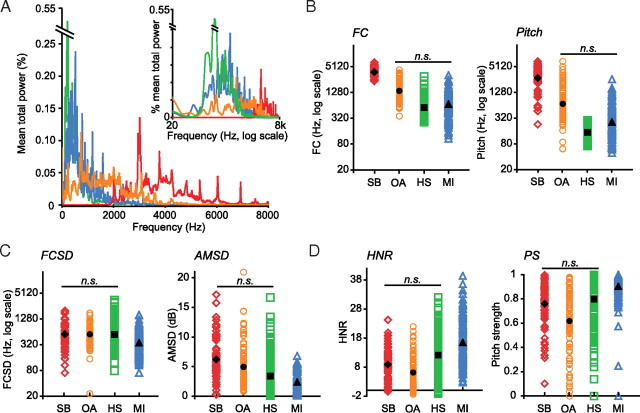
Acoustic features as a function of stimulus category. A, Mean power spectra are plotted for each stimulus category (SBs, red; OAs, orange; HS, green; MIs, blue; color scheme remains consistent throughout). Frequency is plotted in linear scale on the x-axis, while intensity is plotted on the y-axis. Mean power spectra are plotted again in the inset, with frequency shown in log scale along the x-axis, which better approximates the perceptual distances between frequencies in humans. B, Spectral content. FC (left) and pitch (right) are plotted in color for each stimulus; mean values are in black. y-axes are plotted in log scale. C, Temporal variability. FCSD values (left) and AMSD values (right) are plotted as in B. D, Spectral structure. HNR (left) and PS (right) are plotted as in B and C.

