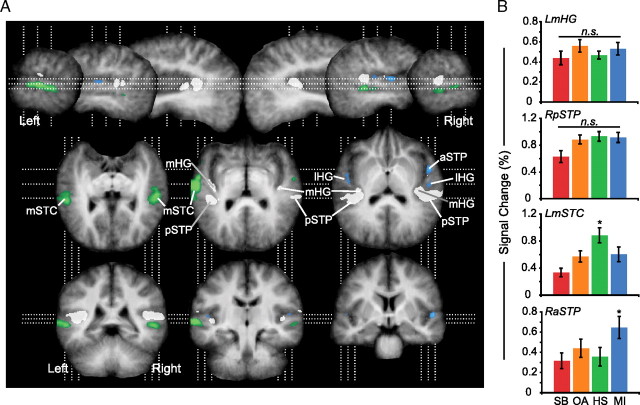
Figure 3.
Category-selective regions of auditory cortex. A, Group functional maps are overlaid on group-averaged anatomical images, rotated to visualize the superior temporal plane in oblique horizontal sections. Category-selective voxels are shown in color: green clusters indicate regions selectively responsive to human speech sounds; blue indicates clusters selective for musical instrument sounds. No voxels were selective for songbird or other animal sounds. Significant category-selective voxels reflect the results of independent conjunction analyses, identifying areas significantly greater for each category than each remaining category (p(corr) < 0.05). White voxels were significantly active for all four stimulus categories (t(14) > 3.79, p(uncorr) < 0.005) but demonstrated no significant differences between pairwise comparisons of category (p(corr) > 0.05). Sagittal sections are 10 mm apart within each hemisphere (top row). Oblique horizontal images (middle) are 7 mm apart and are arranged from inferior (left) to superior (right). Coronal sections (bottom) are 17 mm apart and arranged from posterior to anterior. B, Signal is plotted for representative functional voxels from clusters that exhibited no significant difference (n.s.) in response across categories (mHG, pSTP) and two category-selective clusters (speech, LmSTC; music, RaSTP).

