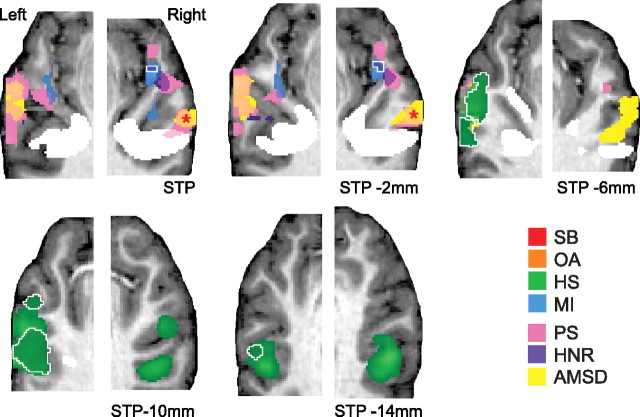
Figure 4.
Sensitivity to acoustic features in auditory cortex. Group functional maps from the standard (Fig. 3) and combined models are overlaid on anatomical images from a single representative subject, rotated to visualize STP. The combined model included both stimulus category and acoustic features (FC, PS, HNR, FCSD, and AMSD) as model regressors. Category-selective voxels from the standard model are shown in light green (HS) and light blue (HS). Remaining category-selective voxels identified with the combined model (i.e., after statistically controlling for the acoustic feature effects) are depicted in dark green (HS) and dark blue (MI) and encircled in white. Clusters exhibited significant relationships with acoustic features, including PS (pink), HNR (purple), and AMSD (yellow). The asterisk marks the cluster exhibiting a significant parametric relationship with AMSD in both combined models (see Materials and Methods) (supplemental Table 3, available at www.jneurosci.org as supplemental material). White voxels are marked as in Figure 3.

