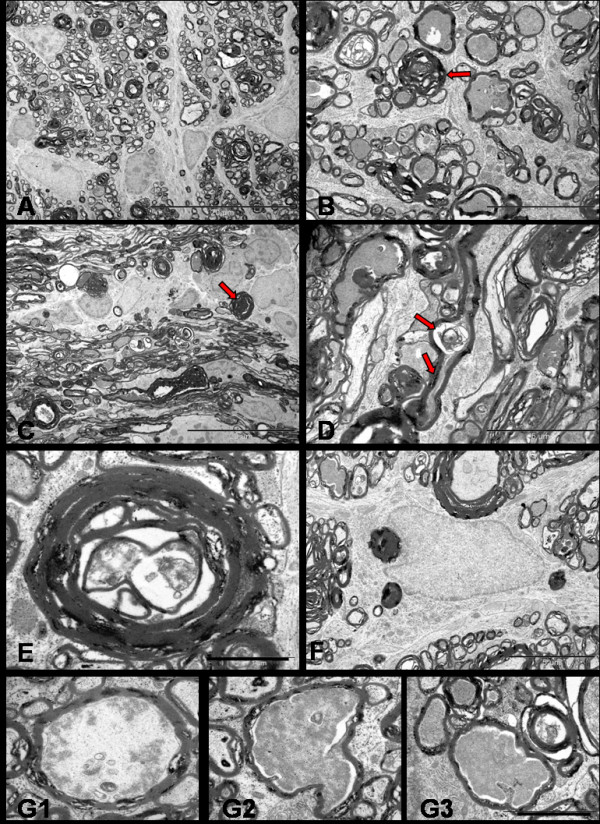
Figure 11.

TEM of distal segment of rat optic nerve after 7 days of NMDA injection. Transverse (A, Bar = 20 μm & B, Bar = 5 μm) and longitudinal sections (C, Bar = 20 μm & D = Bar = 5 μm) show the fibres undergoing dark degeneration with most axons showing hyperdense axoplasm (red arrows). Longitudinal profile show the focal axonal swelling and hyperdense axoplasm in the same axon (D, arrows). Axon towards the end stage of degeneration (E, Bar = 1 μm) show nearly collapsed axon structure and the myelin debris phagocytosed by the astrocytes (F, Bar = 5 μm). Last series of photographs (G1, G2, G3, Bar = 2 μm) represent axoplasm in various stages of dissolution.
